In this article
Many traders are told: “Only take trades with at least 1:2 risk-reward.” It is good advice — but it is only half of the story. A setup makes money only when its risk-reward and its win rate work together.
What is risk-reward?
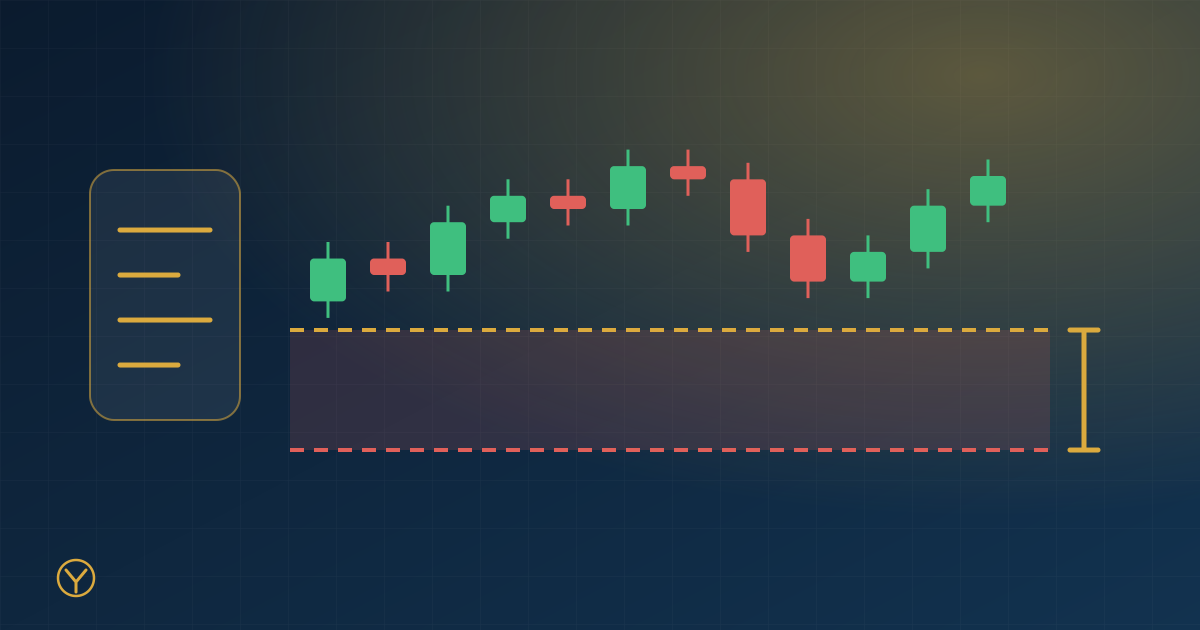
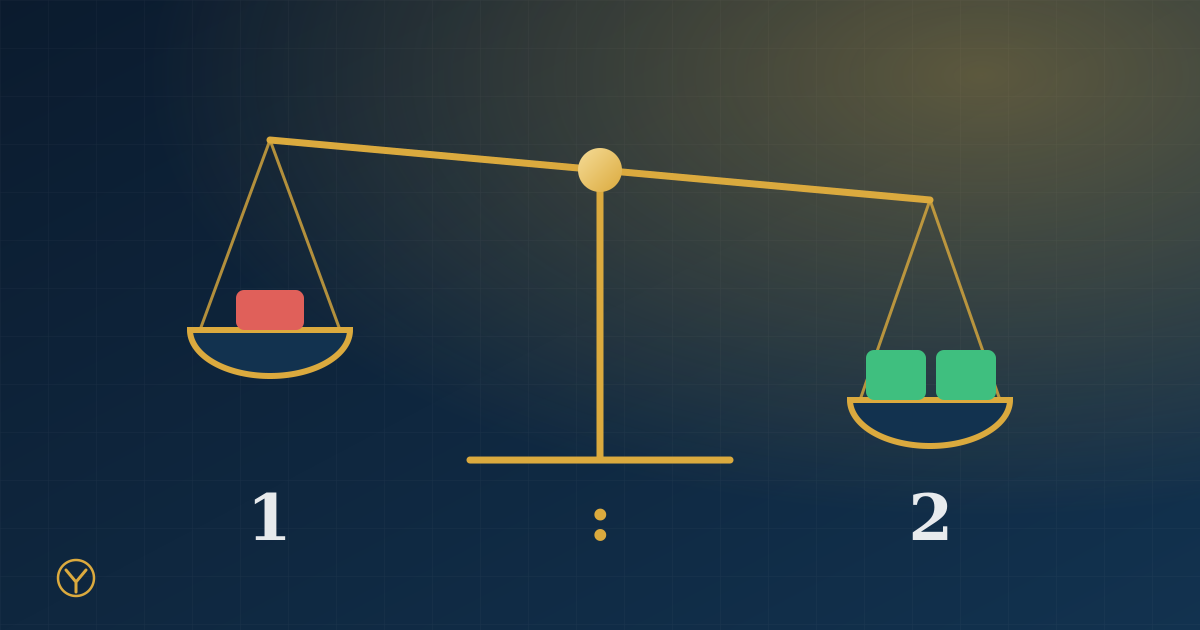
If you risk ₹10 per share (entry minus stop-loss) and your target is ₹20 away, the risk-reward is 1:2. You aim to earn twice what you risk.
The win rate you need to break even
Because a winner pays more than a loser costs, you do not have to win every time. The break-even win rate is:
Break-even win rate = 1 ÷ (1 + reward per unit of risk)
| Risk-reward | Win rate needed just to break even |
|---|---|
| 1 : 1 | 50% |
| 1 : 1.5 | 40% |
| 1 : 2 | 33.3% |
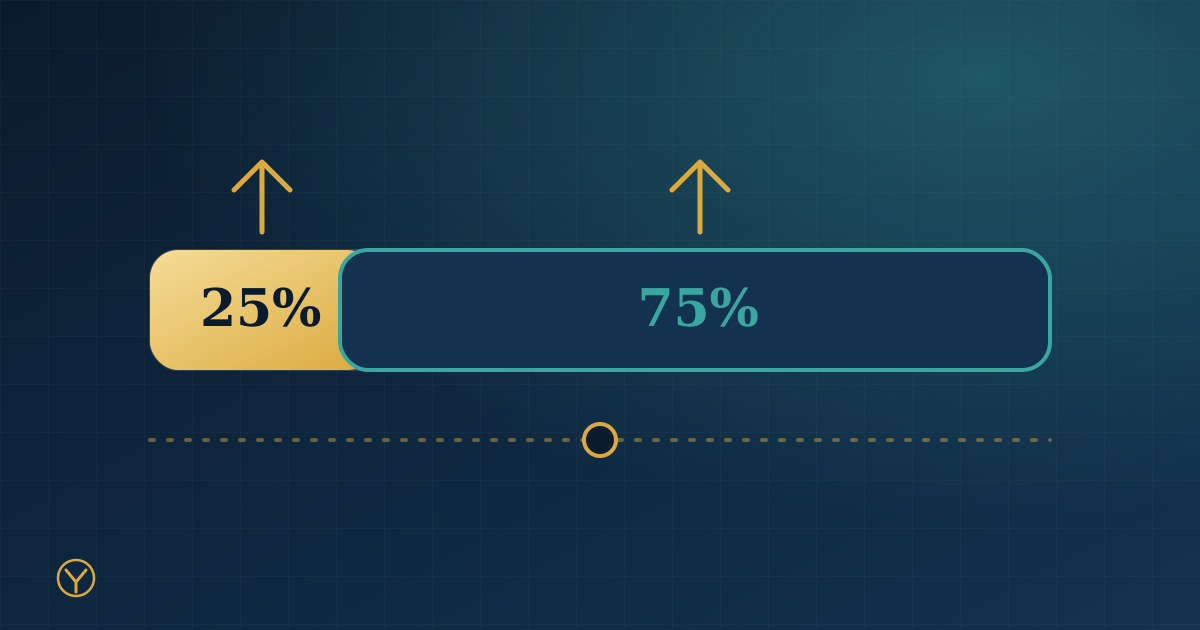
| 1 : 3 | 25% |
Below these win rates, the setup loses money — before costs.
Expectancy: what a trade earns on average
Expectancy, measured in “R” (one R = the amount you risk), tells you the average result per trade:
Expectancy = win rate × reward − (1 − win rate) × 1
| Win rate | Risk-reward | Expectancy per trade |
|---|---|---|
| 30% | 1 : 2 | −0.10 R (loses) |
| 40% | 1 : 2 | +0.20 R (earns) |
| 50% | 1 : 1 | 0.00 R (break-even) |
| 35% | 1 : 3 | +0.40 R (earns) |
Take the second row. If you risk ₹1,000 per trade, +0.20 R means an average of ₹200 per trade over many trades — not on every trade.
Why a “good” 1:2 can still lose
- Your real win rate is lower than you believe, because you remember winners more clearly.
- You exit winners early and let losers run, so the actual reward is smaller than the planned one.
- Costs and slippage eat into a small reward more than into a large one.
- You change the plan mid-trade, so the result no longer belongs to the setup you tested.
How to find your own numbers
Do not use a win rate from a video or a friend. Use yours: from at least 30 to 50 trades of one setup, count the winners, and record the reward you actually got. A trading journal does this counting for you and shows the result per setup, so you can drop what does not work and keep what does.
A simple checklist before every trade
- What is my entry, stop-loss and target?
- What is the risk-reward — and is it what I planned?
- What is my real win rate for this setup, from my own records?
- Is the expectancy positive after costs?